Data Visualization – Why Seeing Is Believing
|
Published: April 04, 2016 |
Len Gasior, Training Engineer, dSPACE Inc.
We have all heard the saying "a picture is worth a thousand words" and instinctively this makes sense. Mankind has evolved over thousands of years to deal with large amounts of information by depending on visual representations such as charts, maps and graphs. This is vital for us in today’s age to understand the vast amount of information more easily and quickly, rather than exhaustively poring over raw data. As it pertains to areas involving electronic test and measurement, the transformation of large amounts of data to a visual format is known as data visualization.
The oscilloscope has been an instrument of choice for engineers for a long time. However, with ever evolving technology and requirements, experimentation software such as dSPACE ControlDesk are providing visualization tools that are more capable and flexible.
Sharing Information through Data Visualization
Data visualization is typically desired in conjunction with or after data acquisition during the process of measuring electrical or physical data. When performed properly, data visualization enables us to observe, correlate, and analyze phenomena that are not quite easy to do with raw data. Data visualization allows us to see patterns and co-relations that matter. This makes it possible to share engineering information and making decisions efficient. When using dSPACE tools for the development and testing of electronic control units (ECUs) for mechatronic systems, it is critically important to present and interpret large amounts of data in a universal manner for the ultimate goal of solving problems and providing solutions.
4 Types of Plotter Instruments
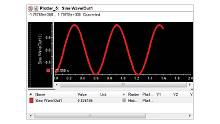
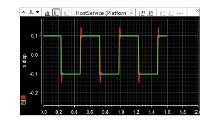
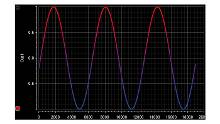
As part of dSPACE’s intuitive host interface software, ControlDesk offers four types of plotter instruments that serve as primary tools for data visualization. Each plotter can display oscilloscope like signals encompassing unique features and characteristics that are customizable, allowing you to display data based on your desired outcome or goal. A brief introduction to the various plotter types follows.
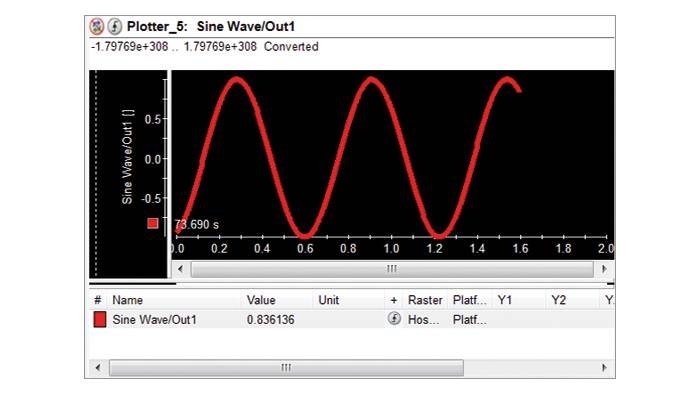
- Standard Plotter – Allows the visualization of signals in relation to the measurement time or in relation to one other signal. Signals can be measured continuously or in triggered mode.
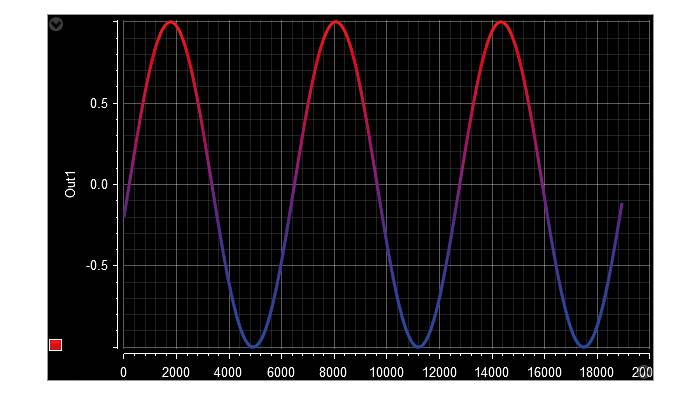
- Time Plotter – Allows the visualization of signals in relation to the measurement time. In comparison to the Standard Plotter, the Time Plotter has an enhanced features such as deriving the frequency of the signal from the plotter itself. Furthermore, its handling is similar to the Index Plotter and the XY Plotter.
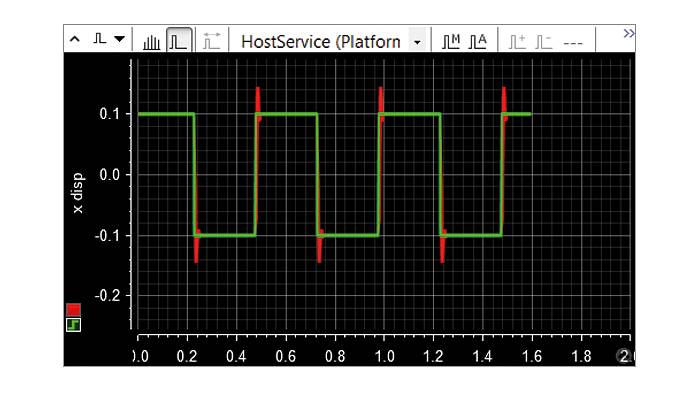
- Index Plotter – Allows for the visualization of signals in relation to events (Interrupts).
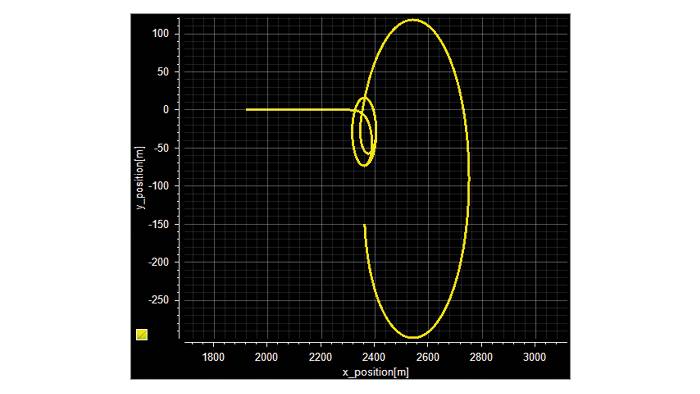
- XY Plotter – Allows for the visualization of signals in relation to other signals. Individual signals can be placed on the X and Y axes.
ControlDesk’s graphical user environment makes it easy to use any number of these plotters in an experiment. Basically, one must simply drag and drop the desired variable(s) onto the respective plotter, configure desired settings and start measurement mode. The selection of the plotter type depends on the engineering information desired by the development engineers. The following pointers are helpful in selecting plotter instruments of ControlDesk appropriately.
- Volume of data – The plotters in ControlDesk activate the measurement mode capability of the system. This means activating a buffer on the target simulation platform (real-time or PC based) to store the simulation data and continuously transferring this information to a storage device for recording purposes.
- Features required – ControlDesk’s plotters offer the many graphing capabilities such as zooming, scrolling, triggered and continuous mode operation. It also provides various advanced features that include post-processing tools such as Y-axes stacked view and XY cursors. Together, these features provide a powerful means to analyze the data post acquisition or on the fly.
- Application requirements – ControlDesk’s plotters were developed with the mindset that every application is different and each user has different objectives and goals when using our tools. Therefore, the plotter instruments are fully customizable to match your application requirements. Whether you’re an automotive engineer measuring crankshaft signals, a rocket scientist measuring actuator operation, or an engineering student measuring switching signals, the plotter instruments provide tremendous flexibility to meet the needs of just about any application.
- Synchronizing data with other sources – What’s really cool about using a dSPACE real time system is that our tools enable you to capture and visualize data from multiple sources, such as ECUs, HILs, GPS and bus systems simultaneously and all synchronized. This ability to correlate data from multiple sources can provide a great advantage for testing and development by reducing your overall toolchain.
In conclusion, dSPACE understands the challenges in performing your work. You’re not alone. To assure your success, we offer training and support on not only for the capabilities mentioned above, but for all of our products. For that reason, don’t hesitate to contact us. So there you have it. Not quite a thousand words, however, when you add up all the data visualization capabilities, options and experience that dSPACE provides, you can be assured that with dSPACE you have the solution you need!
Drive innovation forward. Always on the pulse of technology development.
Subscribe to our expert knowledge. Learn from our successful project examples. Keep up to date on simulation and validation. Subscribe to/manage dSPACE direct and aerospace & defense now.

